
There are a lot of analysis programs for Linux. One of the most famous is the top program. The long-lived top is built into Linux, and derivatives of it are available for most other operating systems.
If you were to type whatis top the results would most likely tell you that it "displays Linux processes". A very simple description for a powerful analysis tool.
The top program does display Linux processes, but it also shows the percentage of CPU and RAM that each process uses. It does this dynamically—meaning, in real-time. It goes further in that you can terminate those processes. That's mainly what I use top for — the analysis and the termination of processes. However, top does more.
Watch the video below for a 30-minute tutorial about top and/or read on for more information.
VIDEO
top Basics
Okay, we've established that top is definitely an awesome program. Let's get into the program itself a little bit.
To run top, simply open a terminal and type top. It will display results that are similar to the figure below.
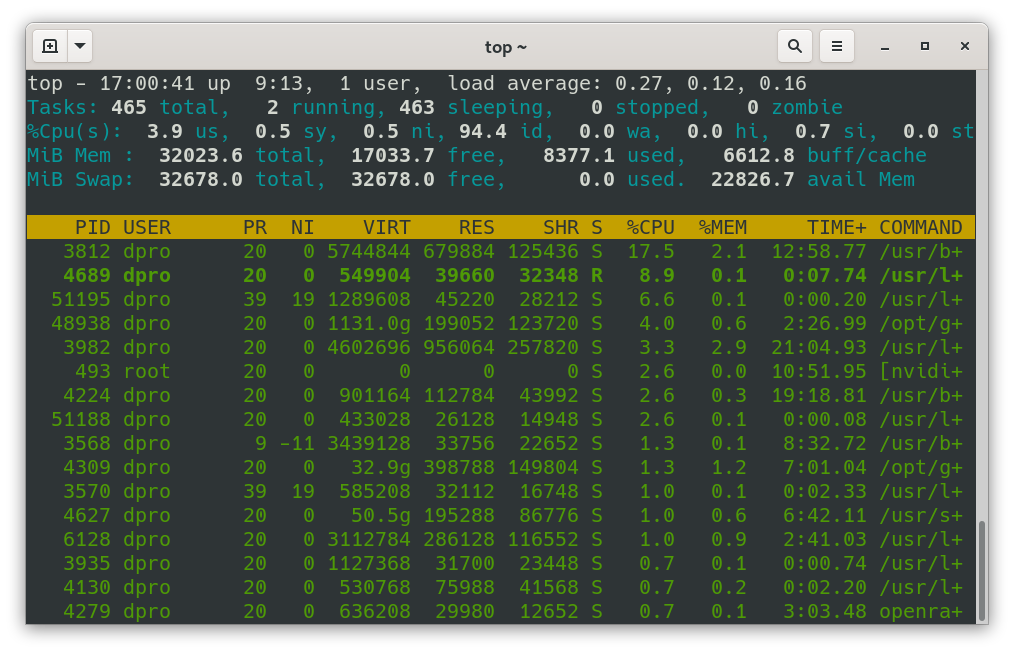
In this figure, we see that top is broken into two sections:
- System Summary: This is above the yellow header. It currently contains five rows of information including CPU, RAM, and tasks. More on this section later.
- List of processes: This is the yellow header and below. We'll focus on this to start.
In the figure, I am working as the dpro user account. You can see the process ID (PID) as well as the CPU and memory usage for each process, among other things.
Note that the process listed in the first row (PID 3812) uses 17.5% of the CPU. The rest are listed in descending order of CPU usage. Of course, that's just the default setting; you can modify this to your heart's content — sort by memory usage - by pressing M, PID - N, Time - T, and so on, and back to the CPU - P.
To find out where it is stored, type whereis top.
1) It can be distracting...
2) Here are a few songs that come to mind... Tennessee Flat-Top Box, It's a Long Way to the Top, You're the Top, Top of the World... um, anyway...
top CPU usage
Let's go further. Look at another screen capture of the top program.
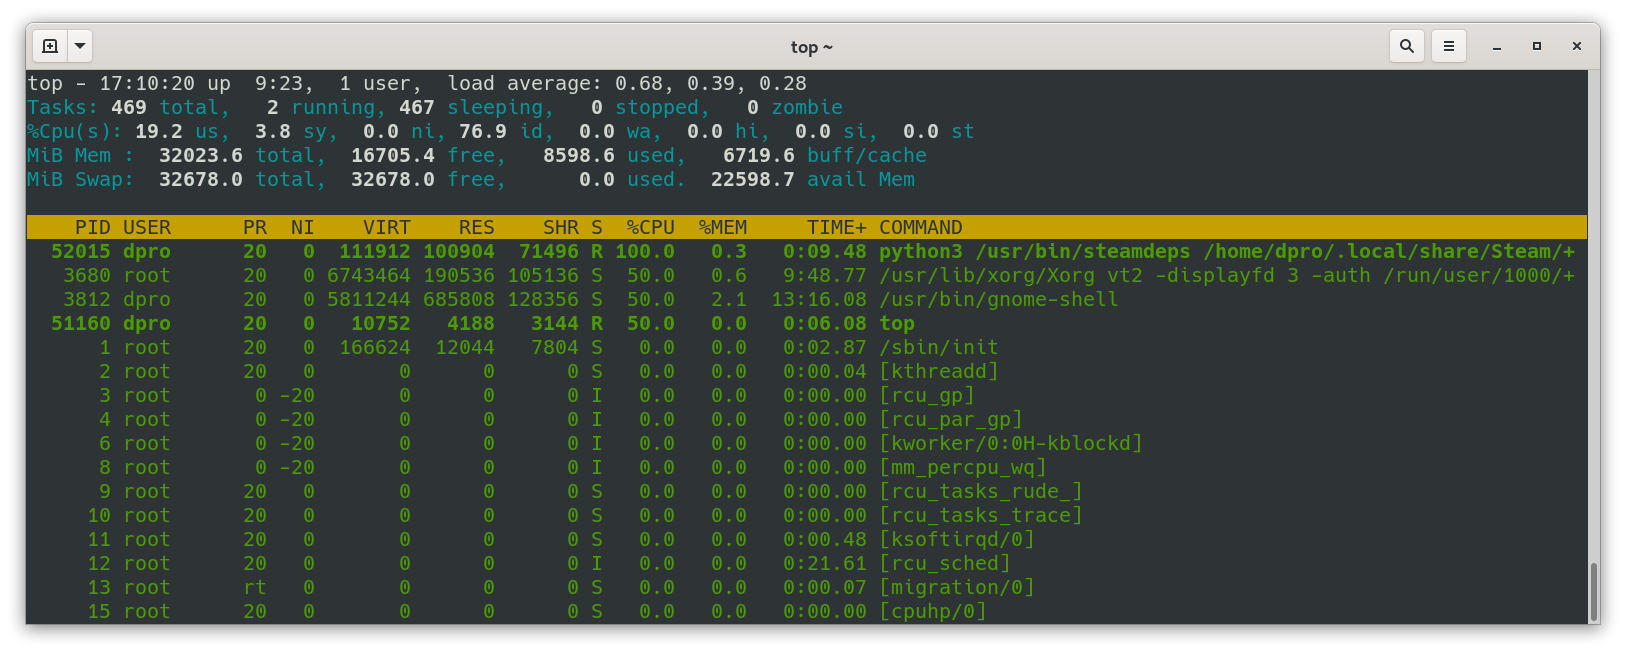
In this case, we see that the uppermost (or "top") process is a Python3 process called Steam. This is process ID 52015. Under the COMMAND column, you'll note the entire path to the program's executable.
You'll also note that it says it is using 100% of the CPU! And then there are other processes using additional percentages. Sounds mathematically impossible at first until you take into account that the total percentage of CPU that can be used is usually more than 100% (in Linux). That's because most systems today have more than one core in their CPU, and each is treated as a separate entity. This particular system has 6 cores, and each of those uses multi-threading, which multiplies that number by 2. That's 12 simultaneous threads. So you could actually say that this system has a maximum CPU output of 1200%. Similarly, a 10-core system would have 20 threads total and would allow for 2000% CPU usage in total.
If you press the 1 key on the keyboard you will see each of the threads and the percentage used for each. An example of this is shown in Figure 3.
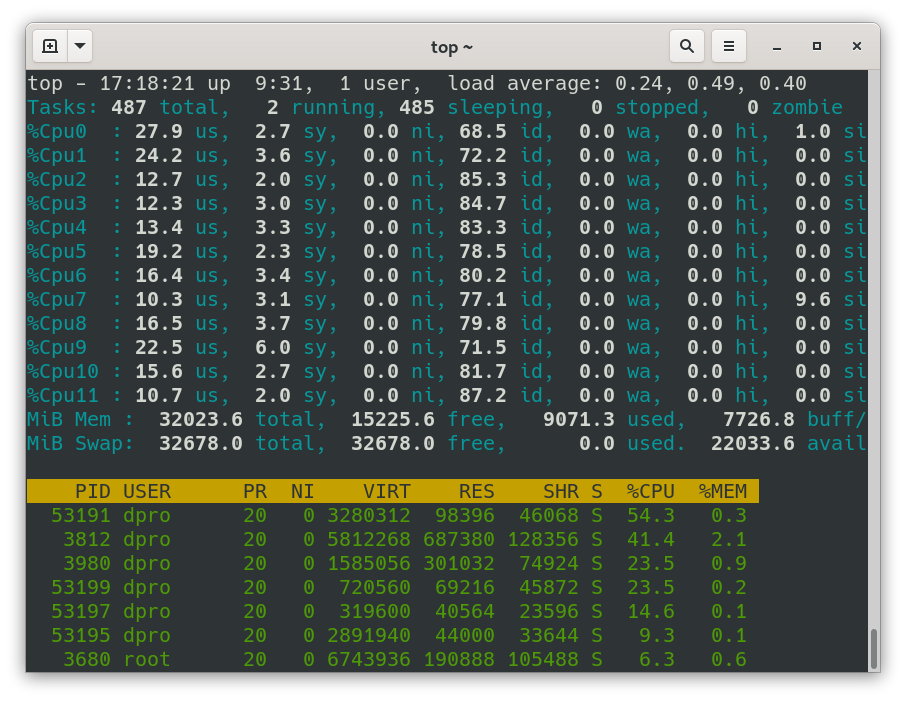
When you press 1 you see the CPU threads listed numerically starting with 0. In the figure, we have Cpu0 through Cpu11 — or 12 threads in total. In this case, each thread has an actual maximum of 100%. Cpu0 is currently at 27.9%. Cpu1 is at 24.2% and so on. If you added the current amounts you would get 201.7%. With a maximum CPU output of 1200%, this system is currently running at about 1/6th of CPU capacity.
To toggle the listed threads back off, simply press the 1 key again. Ultimately, this is the main place where I go to look for load averages.
Total memory and memory used
You can also analyze the memory used with the top program. Take a look at Figure 4.
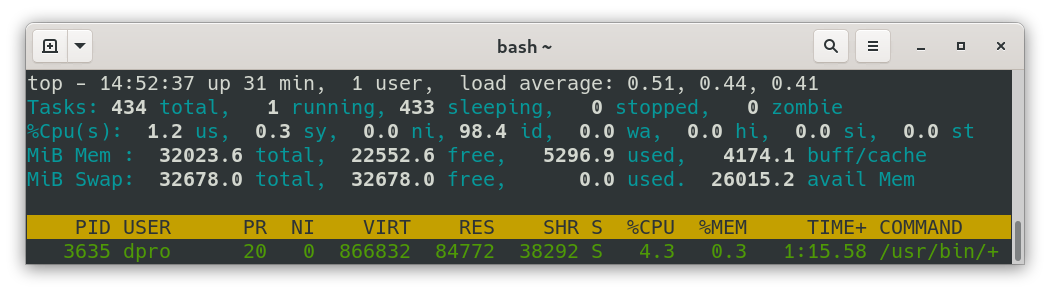
In the fourth row, you can see that the total memory (MiB Mem) is 32023.6 MiB. That's essentially 32 GiB (often referred to simply as 32 GB). Of that total, we are using 5296.9 MiB (or about 5.3 GiB). The available memory for additional processes is 26015.2 MiB.
Note: People often use MB or GB in the place of MiB or Gib. Here's the lowdown on the two:
- 1 megabyte (MB) = 1,000,000 bytes (or 106). It works off of the base 10 system.
- 1 mebibyte = 1,048,576 bytes (or 220). It works off the base 2 system.
When dealing with RAM, the proper term is MiB, and that is what top uses. However, other programs (likefree) will use the deprecated mega/giga terminology.
For more information on mebibytes and the differences between MB and MiB see this link.
Now you may say: "Dave, why show this in MiB, I'm more concerned with GiB!" If you indeed said that, well then, I couldn't hear you. Maybe say it louder next time.— wait, that won't work... Anyway, you can change it within top by pressing the capital E. Repeatedly pressing this key allows you to cycle through the different units of measurement. Or, you could start top in a manner that shows GiB by default: top -E g. Finally, if you want it to show GiB by default, and permanently, simply run top, set it to GiB with E, and then save your top configuration by pressing capital W. Now, every time you open top, it will load your top configuration and display memory in GiB. You can also show the individual processes' memory usage as MiB, GiB, and so on, by pressing lowercase e.
You could also use commands in Linux to check memory. For example, free will show all of the same information about your system's RAM. To show GB instead of MB, use the command free --giga. But again, the beauty of top is that it displays this, and much more information, in one well-designed window.
Troubleshooting with top
As mentioned, I primarily use top to analyze the system and terminate processes that are not behaving. For example, let's say that a web browser freezes up. So we open up top and view the processes. Chances are that the web browser will be listed first, and it will be hovering somewhere around 100% CPU usage. Then, it's just a matter of stopping that process. Easily done!
- Press the
kkey. ("k" for "kill", the less pleasant synonym of "terminate"). By default, it will list the PID that is the highest on the list. - To terminate the listed PID, simply press
enter. If you need to terminate another PID, type in that number and then pressenter. - Press
enterto terminate the process in the default manner. Or, choose the type of signal to send to the PID. By default, it is the #15 signal, called SIGTERM, which is used to signal the standard termination of the process. It attempts to do so in a graceful way but can be blocked or handled by other processes. If 15 doesn't work, the next option is to use signal 9 (SIGKILL), which ends the process immediately, without any interaction. Careful with that, it is an ungraceful termination (a true "kill") and could cause other issues in the system.
At that point, the process should have terminated. If it was a web browser, the window should have closed. In some cases, you might need to reload your desktop by pressing Alt + F2 and typing restart. (Only available with certain desktop modes.)
In the case that you cannot find the process within the top list, you can filter for it by pressing o and then typing COMMAND=<process_name>. So for example, if I wanted to filter for the Firefox browser I would press o and then type COMMAND=firefox-esr. (You could even abbreviate it, for example fire.) That should now show only the Firefox process. This way it is easier to focus on and analyze a single process. When you're done, press = to clear all filters.
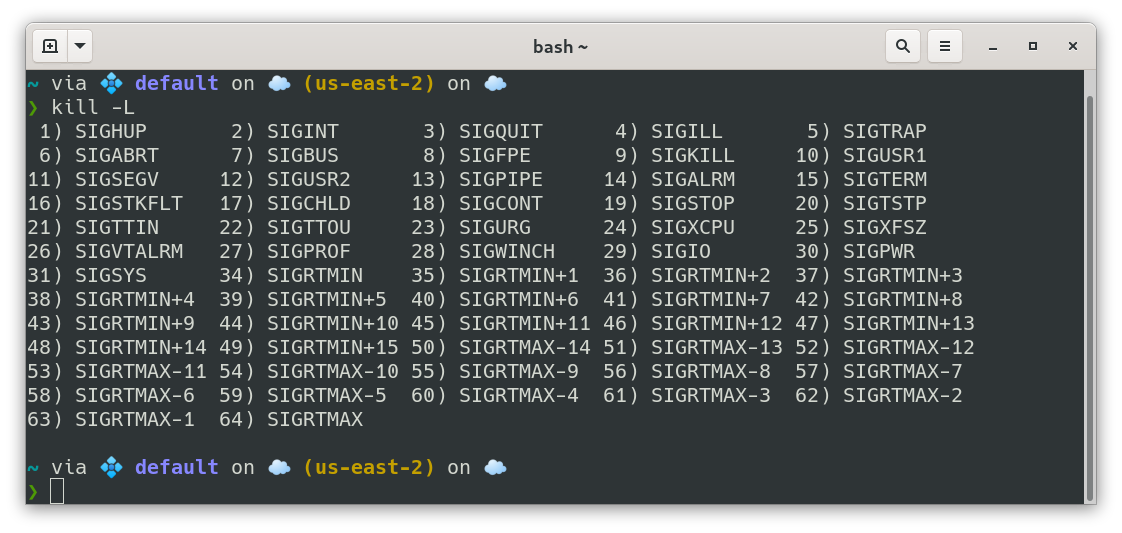
To list them use the kill -L command as shown in the following figure below.
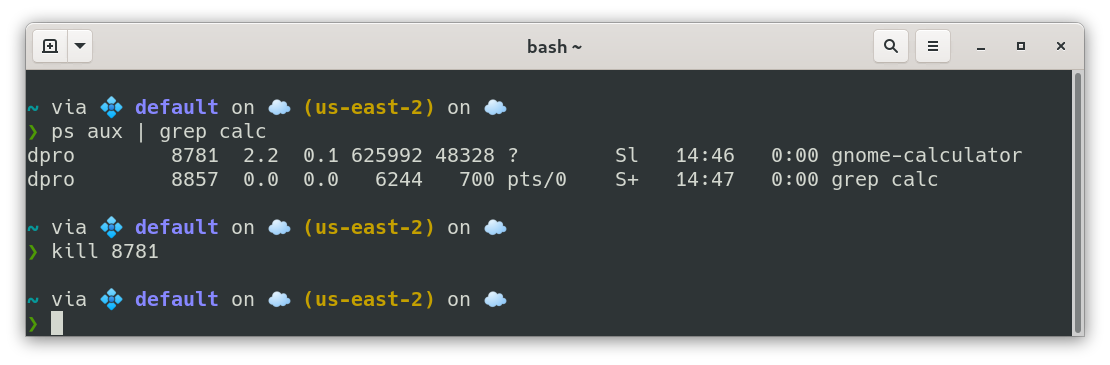
Now, you could use Linux commands to do all this. For example, if the calculator program was malfunctioning: use ps aux | grep calc to locate the PID of the calculator, and then kill <PID_NUMBER> to terminate it (as shown in Figure 5 below). In the figure, you can see that the calculator is called "gnome-calculator" and that it is using process ID 8781. That is the ID we would want to terminate. If completed properly, Linux gives no written results. This is the way.
However, top gives you a single location to do that same procedure, and run an analysis of the system while you are at it. Personally, I like to see the CPU and RAM usage of the system periodically. It's good to keep an eye on such things. But for some reason, if top doesn't work, the previous process would be the backup method for terminating a misbehaving application.
Color Configuration
How about some fun stuff? (I know, all Linux is fun! Right?)
I tend to use color, maybe too much color. And top is no exception. To modify the colors of top, do the following:
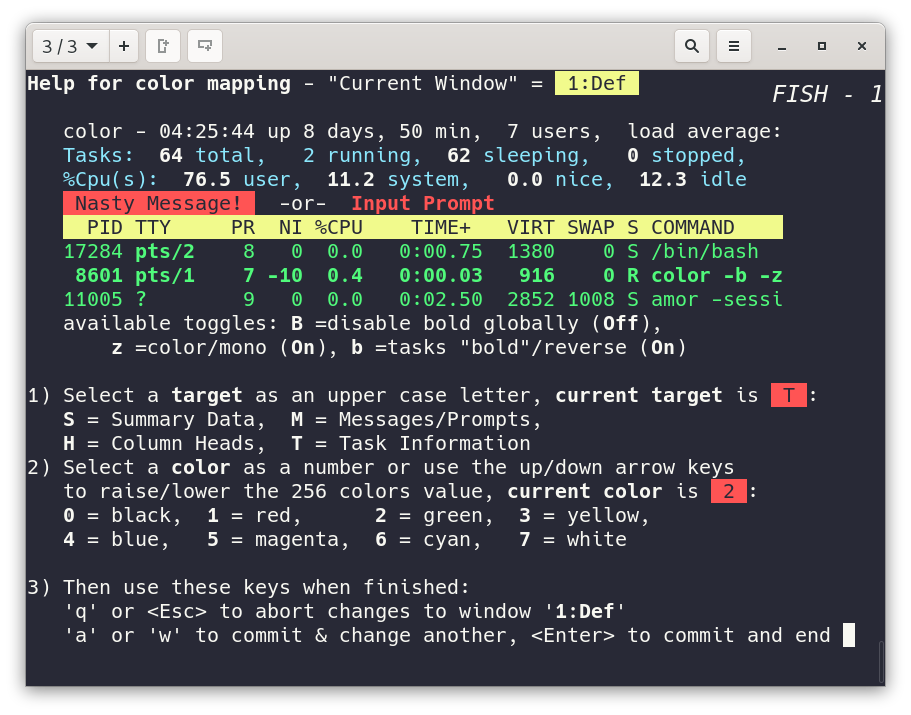
- Press
Zon the keyboard (that's a capital Z). That displays the Color Mapping window as shown in Figure 7 below. - In the Color Mapping window that is displayed, note that you can change the colors for four different elements: Summary Data (S), Messages (M), Column Heads (H), and Task Information (T).
- Select one of the four options by pressing the appropriate key (with
shift). - Then, select a color from 0 to 7. (Good ol' 3-bit color!)
- Repeat for each of the elements as you so desire.
- Press
Enterwhen finished to commit your changes. That will escape back to the main top screen.
Don't forget to press W to write your configuration to disk. Sure beats the giant white wall of text, right?
Alternatives to top
There are plenty of other good analysis programs for Linux: btop, htop, btm (known as "bottom"), monitorix, and the list goes on.
"Stop!" you say? No, there is no stop program, but that's what it is known as when you terminate processes!
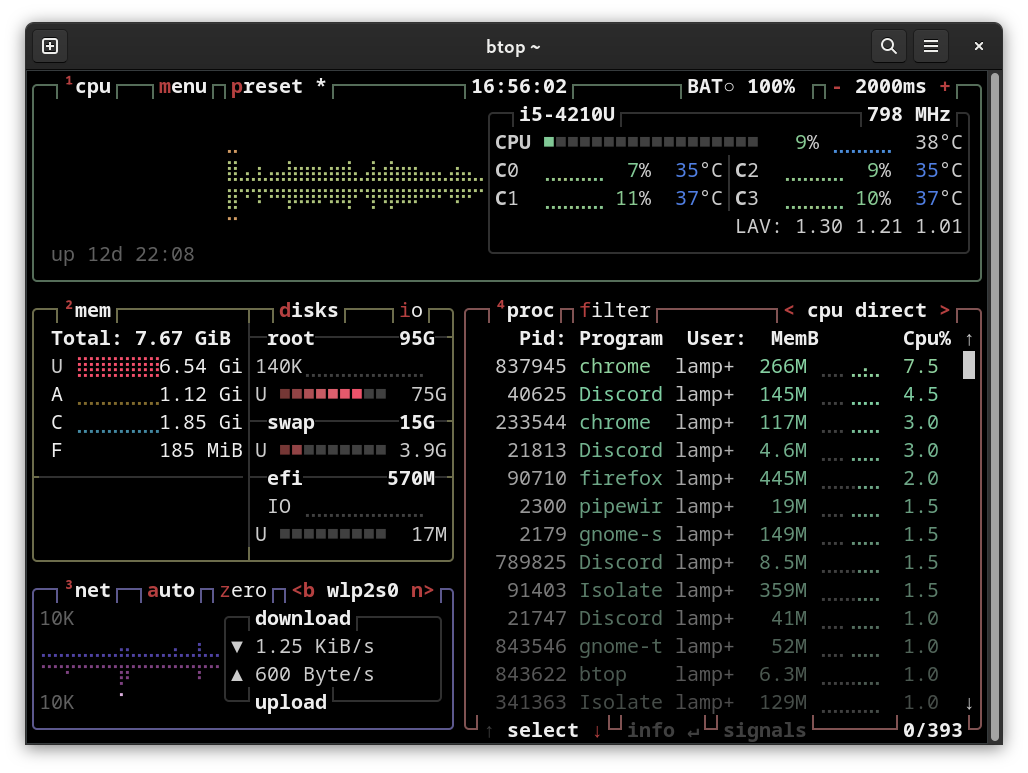
The following figure shows an example of btop. You can see that it is slightly more graphical, and includes power, temperature, disk, and network monitoring, in addition to processes. This is the main analysis tool I use besides top.
Links
Want to learn more? Here are some links for you:
- top man page (online): https://man7.org/linux/man-pages/man1/top.1.html
- I found this nice line-by-line description of top here: https://gist.github.com/mnishiguchi/b927d5df46939e9711c50ec79230ee79
- Linux Under the Hood, by Sander van Vugt. This course goes into some depth about top and many other features of Linux analysis and monitoring. Great course!
O'Reilly Members: https://www.oreilly.com/library/view/linux-under-the/9780134663500/