
The ip command in Linux can be used to analyze, configure, and troubleshoot your system. It's a powerhouse! ⚡
The ip command displays information about interfaces, devices, routing, and tunnels. You can also use it to manipulate those.
For example, the ip a command will show the IP address of the Linux system you are working at (among other things). The IP address might be displayed like this:
inet 10.0.2.51/24For more information about the ip command, try one of the following:
ip --helpman ipip --help displays the basic help file for the ip command. man ip displays the entire manual page for the command. The manual page is the in-depth source of information. Use it!
Watch the following video where I show how to analyze a Linux system with the ip command. Read on for the deep dive into the ip command.
Video
What We'll Cover
We'll be focusing on three commands in this article:
- ip link show (abbreviated to ip l)
- ip address show (abbreviated to ip a)
- ip route show (abbreviated to ip r)
ip link show
Find out Ethernet-based information by typing ip link show or simply ip l.
Below are results of the ip l command run on a Debian client:
root@deb52:~# ip l
1: lo: <LOOPBACK,UP,LOWER_UP> mtu 65536 qdisc noqueue state UNKNOWN mode DEFAULT group default qlen 1000
   link/loopback 00:00:00:00:00:00 brd 00:00:00:00:00:00
2: enp1s0: <BROADCAST,MULTICAST,UP,LOWER_UP> mtu 1500 qdisc pfifo_fast state UP mode DEFAULT group default qlen 1000
   link/ether 52:54:00:6d:fb:ac brd ff:ff:ff:ff:ff:ff
3: virbr0: <NO-CARRIER,BROADCAST,MULTICAST,UP> mtu 1500 qdisc noqueue state DOWN mode DEFAULT group default qlen 1000
   link/ether 52:54:00:69:db:db brd ff:ff:ff:ff:ff:ff
4: virbr0-nic: <BROADCAST,MULTICAST> mtu 1500 qdisc pfifo_fast master virbr0 state DOWN mode DEFAULT group default qlen 1000
   link/ether 52:54:00:69:db:db brd ff:ff:ff:ff:ff:ff
This shows two interfaces:
- lo, which is the local loopback, something that is found by default on every system that runs TCP/IP.
- enp1s0, which is the main network interface on this particular system, used to access other systems and the Internet.The name could be different depending on what Linux distribution you are using and whether it is a physical system, or if virtual, what virtualization system it is on, or if it is on the cloud, what cloud provider you are using!
From this list we can see the ethernet-based information of each network connection on the system. For example, the 2nd connection enp1s0 has a MAC address of 52:54:00:6d:fb:ac. The MAC address is normally 6 octets and is colon-separated. This address is burned into the PROM chip of the network interface, or (in the case of virtual machines) it is assigned to a virtual network interface. We also see that enp1s0 is "UP", meaning that it is activated and ready to transmit and receive data.
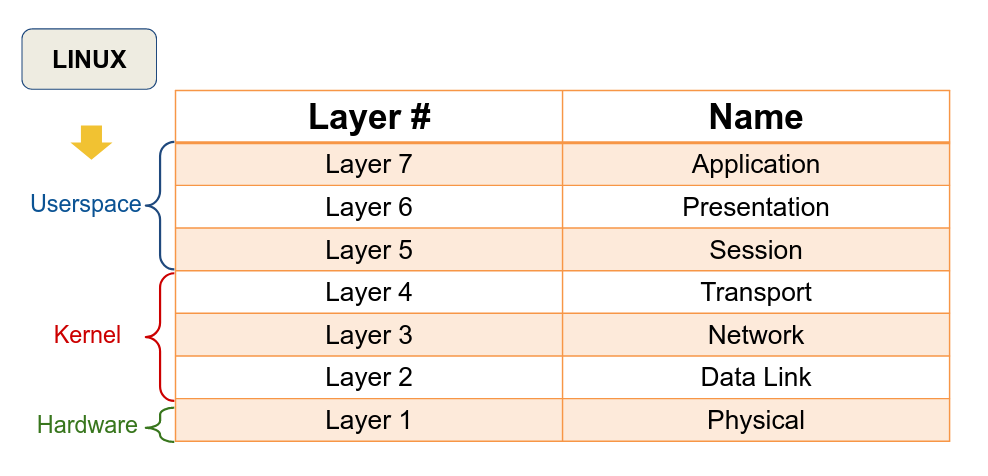
The ip l command mainly deals with Layer 2 of the OSI model - the data link layer. See Figure 1 below for a refresher of the OSI model. This layer is responsible for the transmission of Ethernet frames of data.
ip address show
Discover IPv4 and IPv6 addresses by typing ip address show or simply ip a.
Below are results of the ip a command run on a Debian client:
root@deb52:~# ip a
1: lo: <LOOPBACK,UP,LOWER_UP> mtu 65536 qdisc noqueue state UNKNOWN group default qlen 1000
   link/loopback 00:00:00:00:00:00 brd 00:00:00:00:00:00
   inet 127.0.0.1/8 scope host lo
      valid_lft forever preferred_lft forever
   inet6 ::1/128 scope host
      valid_lft forever preferred_lft forever
2: enp1s0: <BROADCAST,MULTICAST,UP,LOWER_UP> mtu 1500 qdisc pfifo_fast state UP group default qlen 1000
   link/ether 52:54:00:6d:fb:ac brd ff:ff:ff:ff:ff:ff
   inet 10.0.2.52/24 brd 10.0.2.255 scope global noprefixroute enp1s0
      valid_lft forever preferred_lft forever
   inet6 fe80::36b4:f533:4478:39c8/64 scope link noprefixroute
      valid_lft forever preferred_lft forever
3: virbr0: <NO-CARRIER,BROADCAST,MULTICAST,UP> mtu 1500 qdisc noqueue state DOWN group default qlen 1000
   link/ether 52:54:00:69:db:db brd ff:ff:ff:ff:ff:ff
   inet 192.168.122.1/24 brd 192.168.122.255 scope global virbr0
      valid_lft forever preferred_lft forever
4: virbr0-nic: <BROADCAST,MULTICAST> mtu 1500 qdisc pfifo_fast master virbr0 state DOWN group default qlen 1000
   link/ether 52:54:00:69:db:db brd ff:ff:ff:ff:ff:ff
Now, in addition to the information shown with the ip link command, we can see the associated IPv4 and IPv6 addresses. For example, the 2nd interface (*enp1s0) hsa the IPv4 address 10.0.2.52/24. However, this command shows a lot of information. And for a system with a lot of network connections, it can quickly become unmanageable. So, we can sort and filter the information as we see fit.
The ip a command mainly deals with Layer 3 of the OSI model - the network layer. (Refer back to Figure 1.) This layer is responsible for the transmission of IP packets (among other things).
Sort and Filter using the ip command
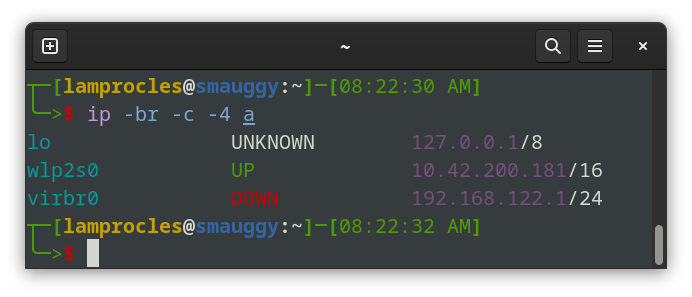
Example 1: ip -br a
root@deb52:~# ip -br a
lo               UNKNOWN        127.0.0.1/8 ::1/128
enp1s0           UP             10.0.2.52/24 fe80::36b4:f533:4478:39c8/64
virbr0           DOWN           192.168.122.1/24
virbr0-nic       DOWN
With this command we get a nice table of information telling us the state of the interface and the IP addresses. Use the -c option to add color. I use it often!
Example 2: ip a | grep inet | sort -n
root@deb52:~# ip a | grep inet | sort -n
    inet 10.0.2.52/24 brd 10.0.2.255 scope global noprefixroute enp1s0
    inet 127.0.0.1/8 scope host lo
    inet 192.168.122.1/24 brd 192.168.122.255 scope global virbr0
    inet6 ::1/128 scope host
    inet6 fe80::36b4:f533:4478:39c8/64 scope link noprefixroute
With this command we filter for the term "inet" and sort the results numerically. You could also add a column -t to make a nice table out of it.
Example 3: ip --oneline addr | column -t
root@deb52:~# ip --oneline addr | column -t
1:  lo      inet   127.0.0.1/8                   scope  host             lo\            valid_lft  forever        preferred_lft  forever
1:  lo      inet6  ::1/128                       scope  host             \              valid_lft  forever        preferred_lft  forever
2:  enp1s0  inet   10.0.2.52/24                  brd    10.0.2.255       scope          global     noprefixroute  enp1s0\        valid_lft      forever        preferred_lft  forever
2:  enp1s0  inet6  fe80::36b4:f533:4478:39c8/64  scope  link             noprefixroute  \          valid_lft      forever        preferred_lft  forever
3:  virbr0  inet   192.168.122.1/24              brd    192.168.122.255  scope          global     virbr0\        valid_lft      forever        preferred_lft  forever
With this command we show each IPv4 and IPv6 interface as one line of information.
You can imagine the possibilities when it comes to a command like ip. Search for, and practice with different options to make your work more efficient, and easier on the eyes.
ifconfig command on Linux. This command is good, but in Linux it is considered to be deprecated. It is recommended to use ip a instead. However, if you feel a need to use ifconfig you can install it by typing sudo apt install net-tools. (Subsitute apt with your package manager if you are not using Debian/Ubuntu.) This will install ifconfig, and some older networking tools including netstat and route.Note:
ifconfig is still used by BSD and some lesser-known Linux distros.ip route show
The ip route show command, abbreviated simply to ip r will display the routed connections and the default gateway for your network interfaces. Take a look at the CLI results below. This shows an ip r command issued from a typical Debian client virtual machine.
dave@pt1:~$ ip r
default via 10.0.2.1 dev enp1s0 proto static metric 100
10.0.2.0/24 dev enp1s0 proto kernel scope link src 10.0.2.52 metric 100
Here we see the default gateway (10.0.2.1) in the first line of the results, and the default network (10.0.2.0/24) in the second line of the results. It also shows which network interface (enp1s0) is used to access the network and its associated IP address (10.0.2.52).
For fun, try the following commands:
ip r -c | column -t
This displays the contents in color and with nice columns.
Here's another variation:
ip r | grep default
This command filters out the line in the results that includes "default". So the only line item that is returned is the one with the default gateway.
ip route Scenario:
Did you ever hear a customer yell? I have, and once or twice when it wasn't even my fault! :)
I remember one time, after arriving at a customer, a manager was quite upset because a Linux server was not accessible. The problem: employees from the company's remote office could not FTP to it. The in-house tech had no idea why.
Now, the company I worked for had set the server up for the customer (not me personally, but I read the documentation and case log etc...) and found it was an Ubuntu server acting as an FTP system.
After running a few passive commands I found out that the server was missing its default gateway. For this particular system, that meant that it could not connect to the Internet. Local connections from people were fine, but those remote connections from the Internet were not functioning.
Since I had already seen the documentation, I knew what the default gateway was, and plugged it into the server using the ip r command.
We can simulate the issue as a lab. Here we go:
First, remove the default gateway:
ip route delete defaultNow run the ip r command and take note of the missing gateway! Also, try pinging anything from this system. It should not work. Network connectivity is down until the gateway address is configured.
Put it back with the following command:
ip route add default via <ip_address>For example, if your network is 10.0.2.0 and your default gateway is 10.0.2.1, then the command would be:
ip route add default via 10.0.2.1Now run the ip r command again. You should see the default gateway. Also, your pings and other tests should function once again.
There you go. All fixed. Could look like a massive problem at first, but really, the solution was pretty simple and logical.
But we have to always ask why a thing like this could happen. From my experience, configuration errors occur due to one of two things: a lack of updates, or user error (or a combination of the two!)
After further review, I found that the server had not been updated in over a year. That led me to question if it might have been compromised. I scanned the system and found malware in the /tmp directory. That was because /tmp was universally writeable (a setting I often disable).
As you can guess, the system needed to be isolated and overhauled. As you can further guess, there was more yelling involved. So I grinned, pulled out my trusty ear plugs, and got to work. After an hour, the server was scanned, cleaned, updated, and ready to go—faster than ever. (If it was a Windows system, I would have re-imaged it on the spot, but I always try to salvage Linux servers, if they are indeed salvageable!)
Creating a New Route with ip r
You can also utilize the ip r command to add new routes. Let's say you need to connect to a second network. Perhaps it needs to look something like this:
- NIC #1: 10.10.38.0/24
- NIC #2: 10.10.39.0/24
Currently, the Linux system connects to the 10.10.38.0 network just fine. But the 2nd NIC (though configured with an IP address), can't connect past the 10.10.39.0 network. We can add the network needed with a command similar to the following:
ip r add <ip_network> dev <network_interface>For example:
ip r add 10.10.39.0/24 dev ens3That process will allow connectivity to other networks. To remove that particular route, use the following command:
ip r delete 10.10.39.0/24 dev ens3Modify the network number and network interface as needed.
Displaying the Metric with ip r
Does your system have multiple network connections? Servers and power workstations are famous for this. But how do you configure network transmissions to default to a certain network interface? Configure the metric setting.
The figure below shows an Ubuntu system that operates on the following networks: 10.42.0.0/16 , 192.168.41.0/24, and 192.168.122.0/24.
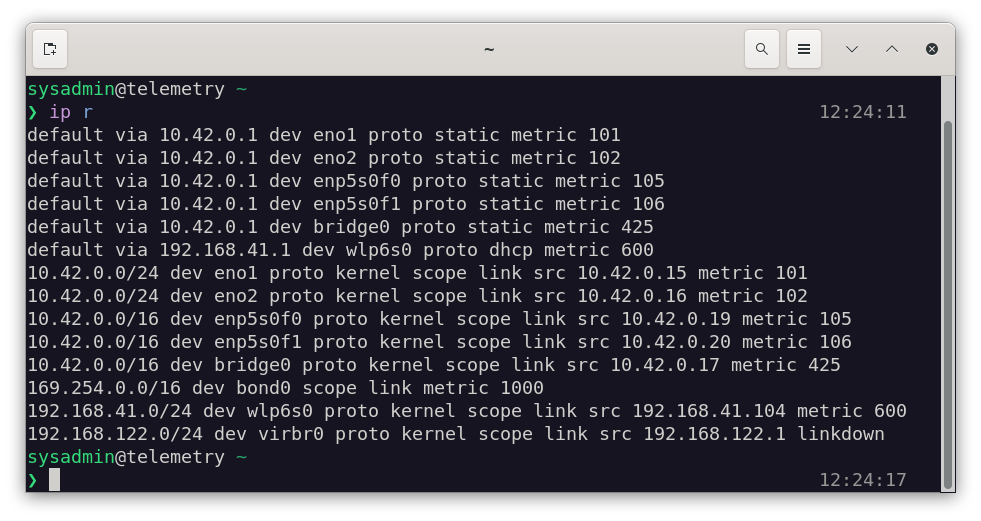
When you run the ip r command it displays the connections and at the end of each line a metric number. The lower the number the higher the precedence. So, by default, packets will attempt to use the network interface eno1 because it has the lowest metric (101). If that device fails, then eno2 will be used, and so on.
The concept of the metric is also advantageous if you are running virtual machines. For example, on my main Linux workstation, I have several network connections. I use the first one for browsing and typical Internet access. I reserve the second one for virtual machine usage only. But if the metrics aren't set up correctly, then my main system's browsing and so forth might use the same network interface as the virtual machines. I don't want this, so I set the main network interface to the lowest metric, with the virtual machine network interface slightly higher. This keeps the traffic compartmentalized (and easier to analyze if need be).
You could modify the metric of a network interface using the ip r command:
ip r replace default via <ip_address> dev <network_interface> metric <#>But you might have mixed results. Especially if your system is running NetworkManager. In that case I would use nmcli. For example:
nmcli connection modify <connection-name> ipv4.route-metric <number>But that's another story...
Summary
The ip command is a powerful analytical tool. Use it to find out information about your network interface, TCP/IP settings, routing, and much more.
Hope you enjoyed this deep-dive article. Until next time!